CLIENT
Code.org (computer science education nonprofit)
GOAL
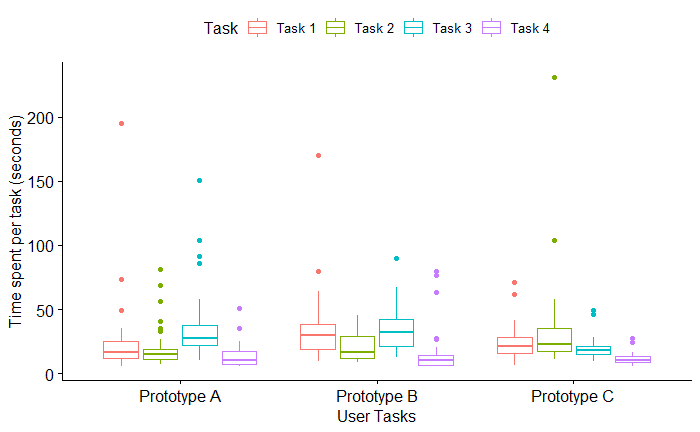
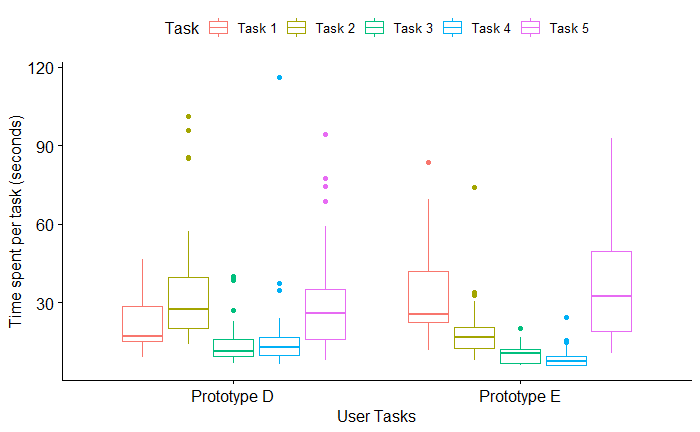
Measure user performance for specific tasks across multiple different
navigation prototypes.
PRIMARY
TOOLS
R & RStudio, RMarkdown, Shiny
BACKGROUND
The client is redesigning their navigation to improve user performance
across specific tasks. They have designed several navigation prototypes
and conducted multiple rounds of user testing for each. The client needs
insightful data analysis that converts data into actionable decision
making.
PRODUCT
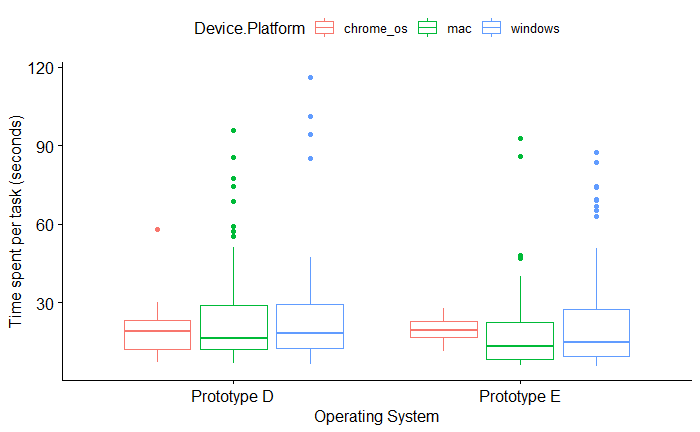
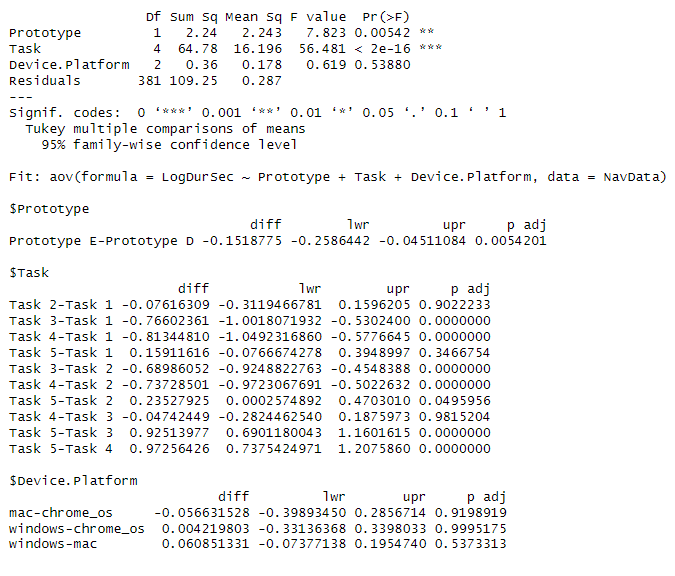
Our team helped the client formulate and test hypotheses to compare user
performance across prototypes. We produced a data report that identified
which prototypes performed best. Our work revealed critical patterns
across user operating system and screen size. We consulted on design
modifications to maximize the client’s desired metrics while minimizing
error rates.
The Challenge: the client’s chosen user testing platform failed
to identify key outliers, resulting in spurious preliminary conclusions
The Solution: we identified and removed notable
outliers, transformed the data to bolster its statistical power, and
consulted on other details of the experimental design to maximize the
data’s utility.
The Challenge: the users participating in the tests used a myriad
of screen sizes and resolutions, including sizes which were not
considered when designing the Navigation.
The Solution:
we tested for anomalous patterns across different screen sizes and
identified key breakpoints where error rates jumped.
Our results demonstrate that users performance is significantly improved
by prototype E. We can confidently recommend Prototype E to the client
if all other factors are equal.
The user testing reports include other metrics of interest, such as a 1-5 rating of how intuitive the user found the prototype. We will further explore the data to identify additional patterns that may inform the client’s choice.